
Process capability index Cpk
Overview
Cpk (process capability index) is a typical indicator used in quality control and SPC (statistical process control). It evaluates how stably measurement data from a manufacturing process stays within the specification limits. Because it accounts for both the offset of the mean and the variation, it is widely used in process capability analysis and quality improvement. This page introduces a Cpk calculation function that can be used on the OMRON NX/NJ series.
- Difference from Cp:
Cp shows the ideal capability assuming the data mean is at the "center of the specification." Cpk, on the other hand, accurately reflects the risk (how likely out-of-spec results are) when the mean is offset from the center.
One-sided defect rate
| Specification limit | CP | Defect rate | Defect rate PPM |
|---|---|---|---|
| 3σ | 1 | 1.4/1000 | 1350 |
| 4σ | 1.33 | 3.2/100000 | 32 |
| 5σ | 1.67 | 2.8/10000000 | 0.28 |
Normal distribution charts
| 3σ | 4σ | 5σ |
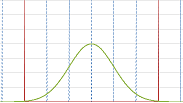 |
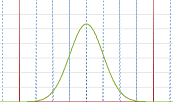 |
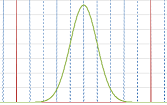 |
Interpretation
If the Cpk value is 1.00 or more, the process capability is judged to be sufficient.
| Cpk value | Interpretation | Description |
|---|---|---|
| 1.33 or more | Good | Process capability is sufficient |
| 1.00~1.33 | Somewhat marginal | Room for improvement |
| Less than 1.00 | Poor | Many out-of-spec results may occur |
| Index | Characteristics |
|---|---|
| CP | Does not consider whether the center is offset |
| Cpk | Also considers center offset (more practical) |
Calculation
This FB calculates as follows
The standard deviation (σ) is obtained using ArySD, a standard NJ function
\[
\sigma = \sqrt{\frac{1}{n}\sum_{i=1}^{n}(x_{i}-\bar{x})^{2}}
\]
Using this with the upper specification limit (USL) and lower specification limit (LSL), the process capability index Cp is calculated
\[
Cp = \frac{USL-LSL}{6\sigma}
\]
The one-sided Cpu and Cpl are calculated
\[
Cpu = \frac{USL - \bar{x}}{3\sigma}
\]
\[
Cpl = \frac{\bar{x}-LSL}{3\sigma}
\]
Cpk is calculated taking the offset into account (the smaller of Cpu and Cpl)
\[
Cpk = min(Cpu, Cpl)
\]
Symbols
CalcCpk
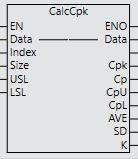
- Data
- Array containing the target data
- Index
- First element number of the array to calculate
- Size
- Number of elements
- USL
- Upper specification limit
- LSL
- Lower specification limit
- Cpk
- Process capability index and variation
- Cp
- Process capability index
- Cpu
- Deviation between the upper specification limit and the process mean
- Cpl
- Deviation between the lower specification limit and the process mean
- AVE
- Mean
- SD
- Standard deviation
- K
- Bias (deviation between the midpoint of the specification limits and the process mean)
Example
Ladder logic
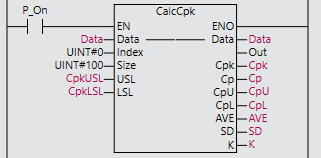
Calculates Cpk for elements 0 to 100 of the Data array
Source
CalcCpk
FAQ
What is Cpk?
Cpk is a type of process capability index that evaluates conformance to specifications, taking into account process variation and the offset of the mean.
What is the difference between Cp and Cpk?
Cp is a capability index that assumes the process mean is at the center of the specification. Cpk also takes the offset of the mean into account, so it represents actual process capability more accurately.
What Cpk value is good enough?
Generally, a Cpk of 1.33 or more is considered sufficient process capability.
Can Cpk be calculated on OMRON NX/NJ?
Yes, using the CalcCpk function block published on this page.
