
Histogram
Overview
Converts data acquired by a high-speed analog unit into histogram data
What Is a Histogram?
Acquired data is divided into fixed intervals (classes), and the number of occurrences (frequency) in each interval is shown as a bar chart
Creating this chart lets you see the variation of the acquired data at a glance
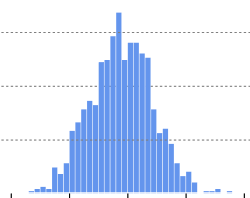
What a histogram shows
- Center of the data
- Size of the variation
- Skew (shift to the left or right)
- Presence of multiple peaks
- Presence of outliers
Relationship with the Normal Distribution
If the histogram is close to bell-shaped, the measured data may follow a normal distribution.
When evaluating the process capability indices Cp and Cpk, a normal distribution is generally assumed.
See process capability index (Cpk) here
Symbols
HistogramHAD
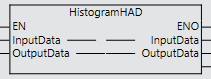
- InputData
- Data acquired by a high-speed analog unit (array)
- OutputData
- Data converted for the histogram
How to Use
InputData
Enter the data acquired from the high-speed analog unit in InputData
In the I/O map of the high-speed analog unit, values are allocated in arrays of 10, such as AnalogInputValue1-10 and AnalogInputValue11-20, so multiple AnalogInputValues must be joined into one array before being input to InputData
Histogram
Set Histogram to a variable with an array of as many elements as the number of divisions for the graph
The high-speed analog unit outputs values from -32000 to +32000, so decide how many divisions to split this range into and create the array
Also add two to the number of divisions for counting values beyond the upper and lower limits
For example
To split -32000 to +32000 into 100 divisions, create a variable with an array of 102 elements (for example HistogramData[0...101])
Then the following element numbers are counted up according to the analog value
| Analog value | Array element number |
|---|---|
| -32000 or less | 0 |
| -31999 ~ -31360 | 1 |
| -31359 ~ -30720 | 2 |
| ... | ... |
| -639 ~ 0 | 50 |
| ... | ... |
| 31361 ~ 32000 | 100 |
| 32001 or more | 101 |
FAQ
What is a histogram?
A bar chart showing the number of occurrences in each interval after classifying data into fixed intervals.
What can a histogram show?
The center of the data, variation, skew, multimodality and whether there are outliers.
How do histograms relate to the normal distribution?
If the histogram is close to bell-shaped, the measured data may follow a normal distribution.
Can histograms be created on OMRON NX/NJ?
Using the HistogramHAD function block, high-speed analog unit data can be converted into histogram data.
